 |
|
| The following gallery of graphs demonstrate the visual range of graphs that GrafEq can produce. There is also a rogue’s gallery of troublesome graphs. | These graphs are possible because of the expressive power of general implicit relations. Each graph has a short description of why it came to be, as well a link to the defining equation and larger views. Interested GrafEq users can generate portions of the graphs at any resolution using GrafEq; many of them are included in the downloadable demo. We invite users of other graphing packages to try some of the graphs as well... | |||
|
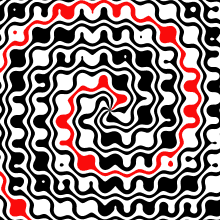
Margarita This graph adorns the front cover of the GrafEq 2.02 manual. It shows seven spirals trying to live within a “square” grid. Two colours were used because of the impending two colour printing process for the manual cover. The red component emphasizes the graph’s spiral nature. |
|
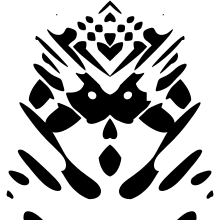
Masked Found partially by luck, this is the GrafEq mascot. I am uncertain whether this shows more about the anthropocentric nature of human vision or the expressiveness of reasonably simple implicit relations. |
|
|
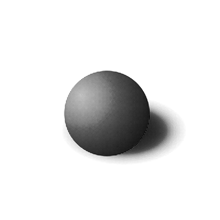
Simply Spherical This graph adorns the back cover of the GrafEq 2.02 manual. Although GrafEq 2.02 only presents two dimensional views of graphs, three dimensional graphs such as this can be fudged by modelling the half toning process within the equation. |
|
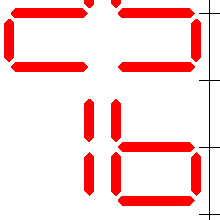
Decimal Squares This graph shows the square integers in base ten. It is an example of a graph based on an enumeration; GrafEq 2.10 handles these sorts of graphs much better than earlier versions of GrafEq. |
|
|
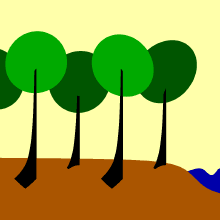
Forest’s Edge A graph expressly made up to demonstrate the colour capabilities of GrafEq—in particular, the layering of several colour graphs. GrafEq users can see how contrived the graph is by zooming out. |
|
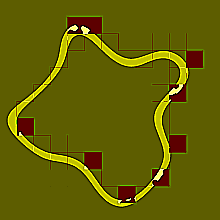
Digital Bacteria One of the earlier graphs to use colour in a visually effective manner, it was created as a demonstration graph for version 2.00. The “digital” portion of the bacteria was also used to test parts of the internal workings of GrafEq 2.00. |
|
|
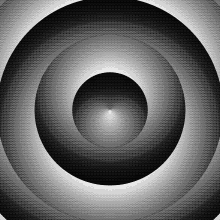
Disc 9 The first half-toned graph created using GrafEq. Prominently shown on the front of our colour brochure for version 2.01, this was made shortly after I realized that halftoning was possible. Close scrutiny will reveal that the half toning pattern used is more geometric than the mathematically simpler one used for the more recent Simply Spherical. |
|
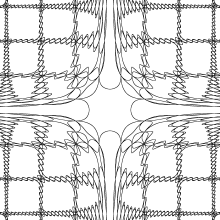
Frontispiece This graph, reminiscent of wrought-iron work, has been front and center on early versions of the manual for the second version of GrafEq. The latest version sports a slightly different graph which lacks the calligraphic strokes present in earlier versions - the strokes are shaved away by the sub-pixel refining added in version 2.02. Artists may prefer to retain the strokes by disabling sub-pixel refining. |
|

|
Sunlight Revealed A cheery exposition of GrafEq’s blending capabilities. Three coloured layers (red, blue, and yellow) are present along with the white “sunlight” layer. GrafEq users can try varying the colour scheme of the primary layers from Manhattan blues to Arizona tans. |
|
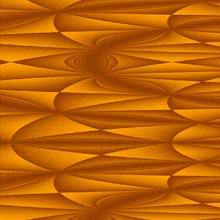
Chrome The first gallery picture produced with GrafEq 2.03. |
|
|
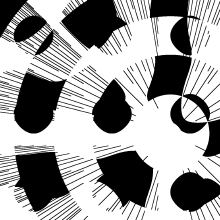
Jupiter’s Dawn A moderately simple graph which exhibits both one an two dimensional regions. The graph is given using the generalized max operator. |
|
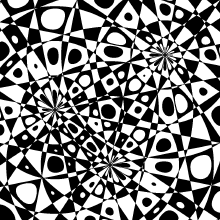
Threesome In the full view, a clear mind can see the three beings. This graph was conjured up by combining several translated concentric patterns using a XOR-like operator. GrafEq users can see the individual pieces by removing factors from the defining equation. |
|
|
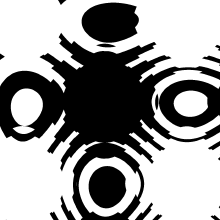
Arachnid A stark, if somewhat unfriendly graph made up shortly after I started experiencing “apartment life”. Needless to say, this graph helped strengthen my resolve to completely eradicate all unwanted guests. Fastidious cleaning has resulted in not seeing any of these sorts of guests since moving in. |
|
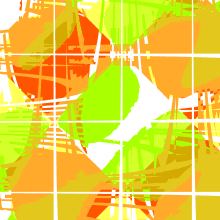
Cracked Flowers Created after an autumn afternoon stroll through a local park. The lower right gives away its heritage, while the upper left speaks of its creation. |
|
|
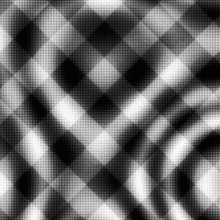
Plaid Meltdown A half-toned graph showing both a regular and irregular pattern. |
|
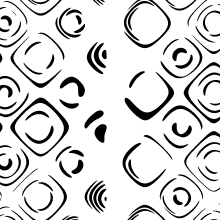
The Big Swim Some find this graph fascinating for the variety of pleasing, smooth shapes generated by a single, simple equation. Modifying the equation seems to needlessly complicate both the graph and its definition. |
|