 |
 |
|
GrafEq provides / supports the following distinguishing features.
(For details, click on a feature.)
|
Accurate, Precise, and Robust graphing
GrafEq’s graphing engine is both robust and precise. The following definitions will help clarify the matter:
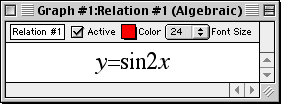
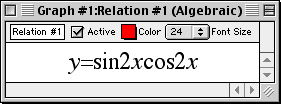
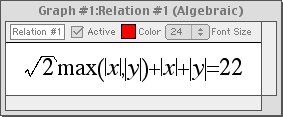
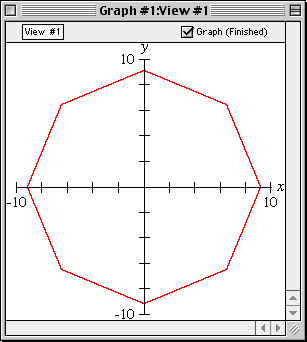
GrafEq Accepts Standard Math Formats
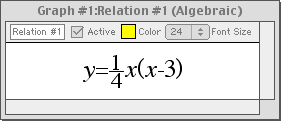
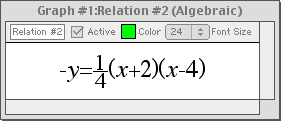
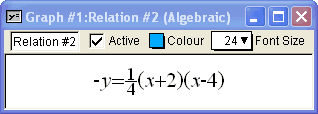
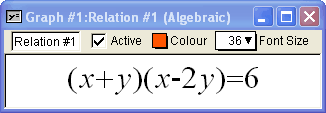
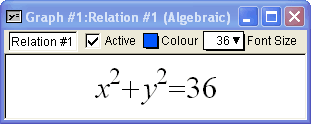
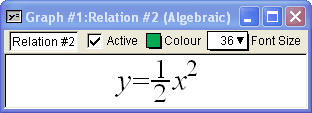
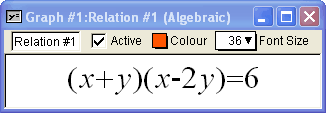
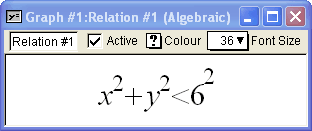
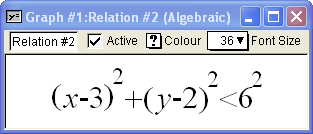
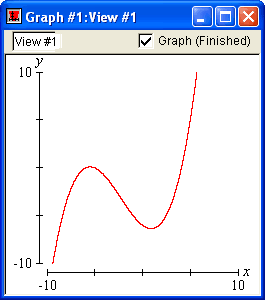
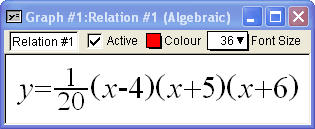
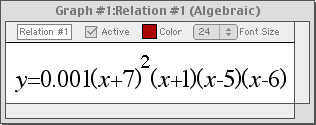
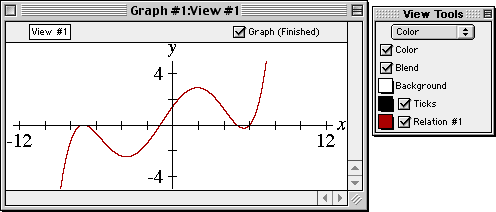
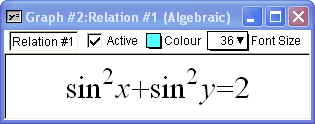
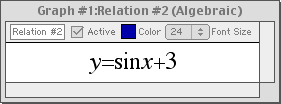
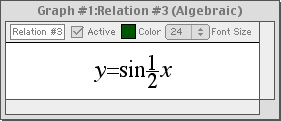
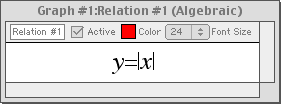
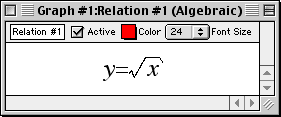
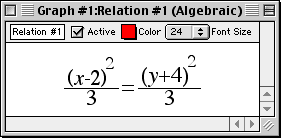
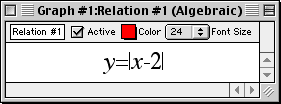
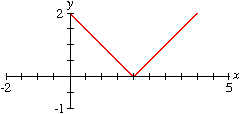
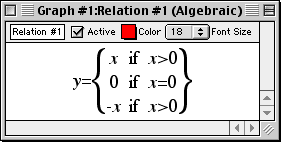
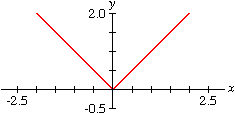
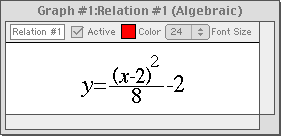
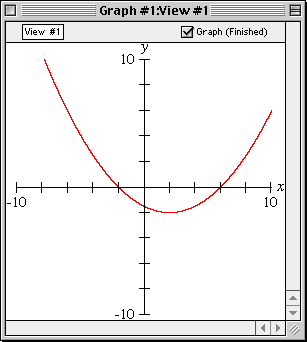
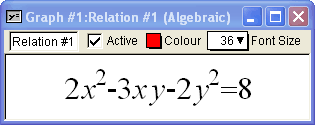
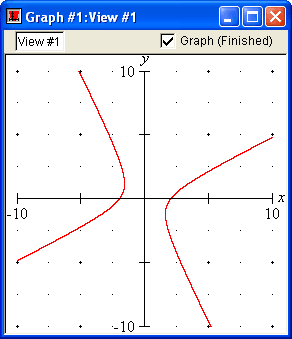
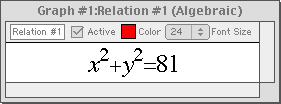
With GrafEq, equations may be entered naturally, using any standard form. For example:
Easy Buttons
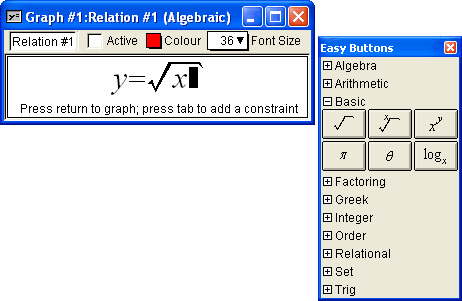
GrafEq’s relation input windows are equipped with ten sets of easy buttons for entering special symbols. Easy buttons make relation editing simple and easy even for beginners.
Relations
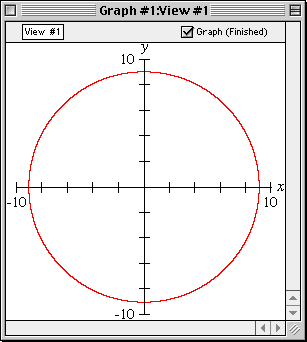
Enter an implicit equation for a relation and GrafEq will plot its graph.
Cartesian Coordinates
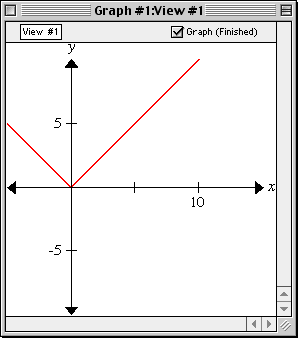
Enter an equation in x and y (or other variables of your choice) GrafEq will plot its graph in Cartesian coordinates.
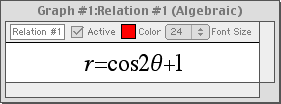
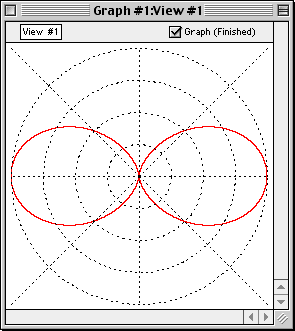
Polar Relations
Polar relations can be displayed with GrafEq. Enter a polar equation in any standard form and GrafEq will plot its graph.
Parametric Relations
Parametric relations can be displayed with GrafEq. GrafEq will plot the graph of a parametric relation given in any standard form.
Trigonometric Functions
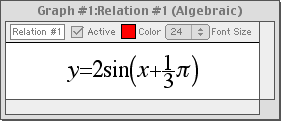
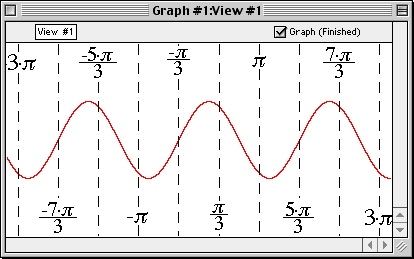
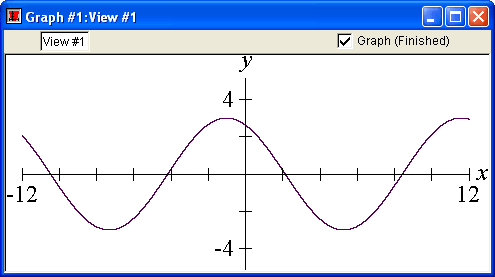
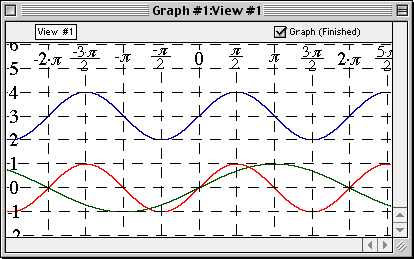
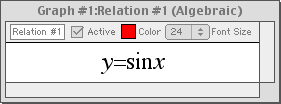
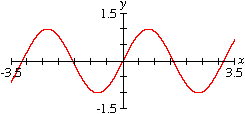
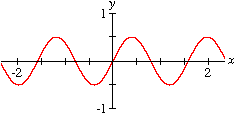
Enter an equation of a trigonometric function in any standard form and GrafEq will plot its graph.
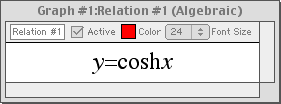
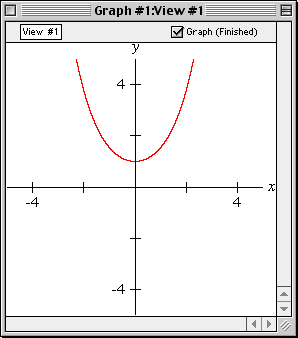
GrafEq supplies hyperbolic trigonometric functions.
While standard trig functions are based on a circle,
hyperbolic trig functions are based on a hyperbola;
GrafEq also supplies trig functions based on a square and on a diamond.
Exponential Functions
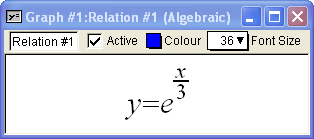
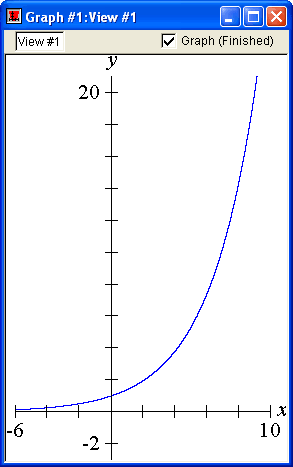
Enter an equation of an exponential function in any standard form and GrafEq will plot its graph.
Constants
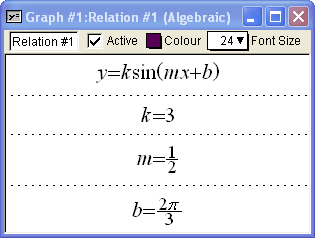
With GrafEq, the values of constants can be specified within the equation, or as separate constraints.
Multiple Constraints
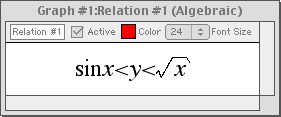
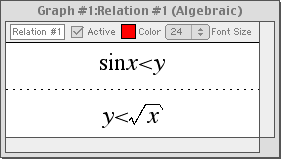
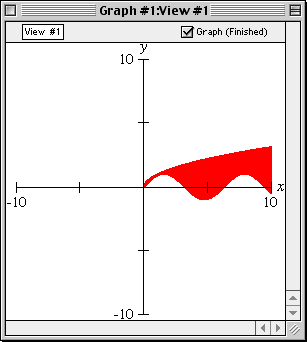
With GrafEq, multiple constraints can be used (and in chains, if so desired).
Zoom In / Zoom Out
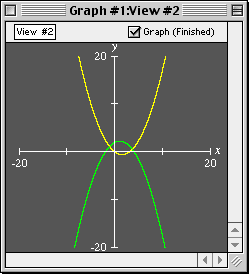
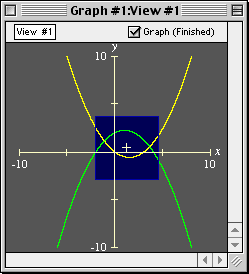
The zoom feature of GrafEq allows both zooming out, to more extensive regions,
and zooming in, to smaller regions.
Note that each inward zoom requires higher precision for graphing. While most graphing programs create incorrect graphs when the platform’s precision limit is reached, GrafEq’s successive refinement graphing method ensures that correct graphs are produced.
Points
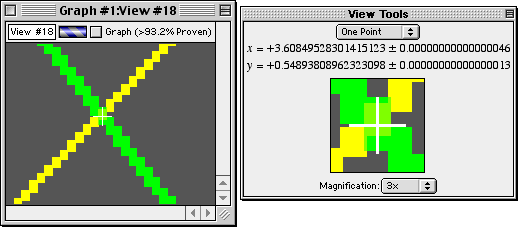
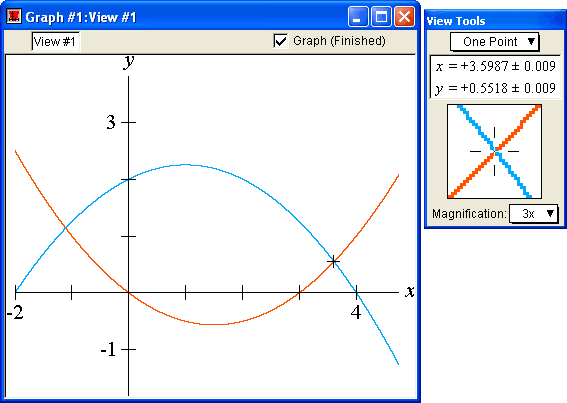
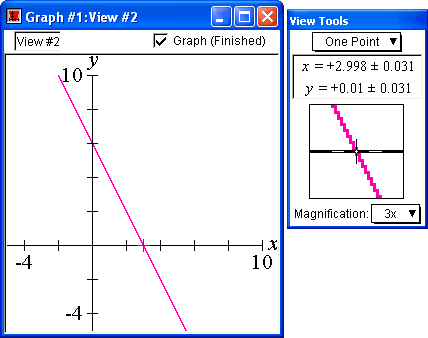
The coordinates of a point can be estimated with GrafEq using the One-Point mode. The zooming feature of GrafEq allows the point to be positioned precisely for accurate estimation.
Slopes
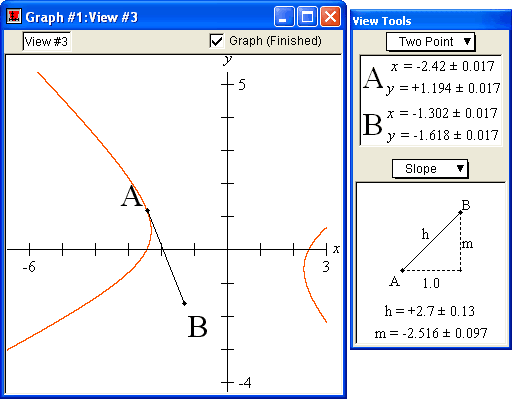
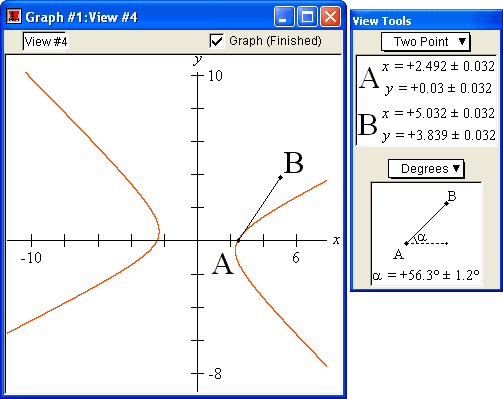
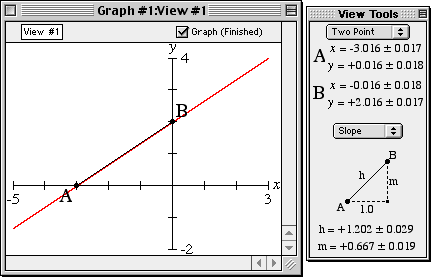
The slope of a curve can be estimated with GrafEq using the Two-Point / Slope mode. The zoom feature of GrafEq allows the endpoints of the line AB to be positioned precisely for accurate estimation.
Distances
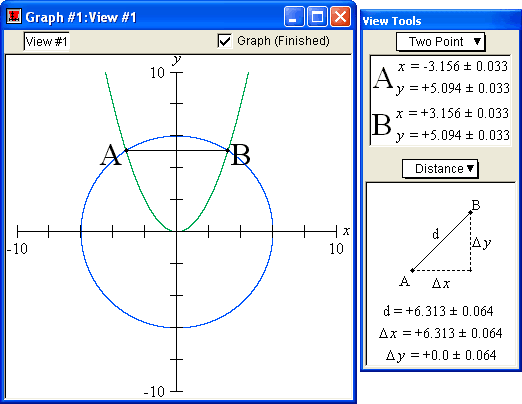
The distance between two points on a curve can be estimated with GrafEq using the Two-Point / Distance mode. Better estimation is possible by zooming.
Angles
The angle between a curve and the x-axis can be estimated with GrafEq using the Two-Point / Degrees mode. The zoom feature of GrafEq allows the endpoints of the line AB to be positioned precisely for accurate estimation.
Custom Ticks
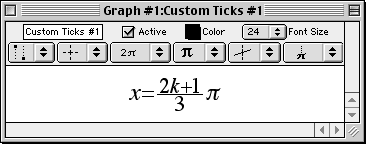
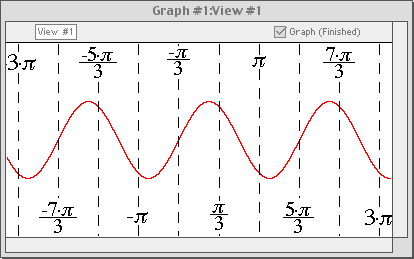
In addition to standard numerical ticks, GrafEq allows users to define custom ticks. Some commonly used ticks, such as multiples of π along the x axis, are preformatted in GrafEq.
Patterns
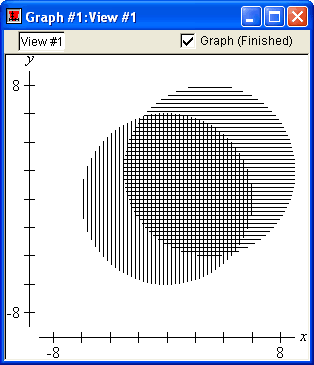
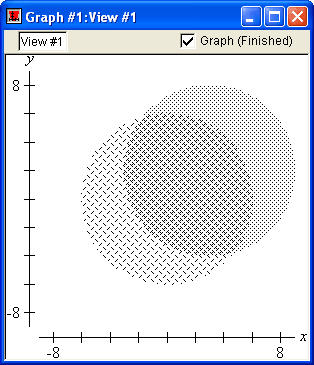
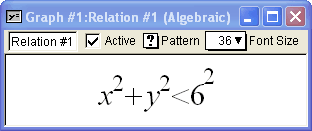
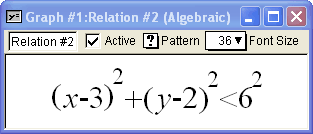
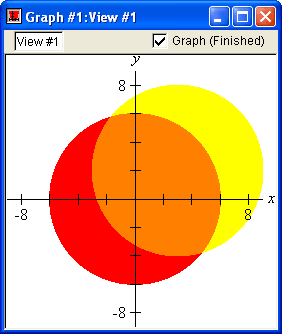
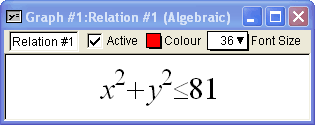
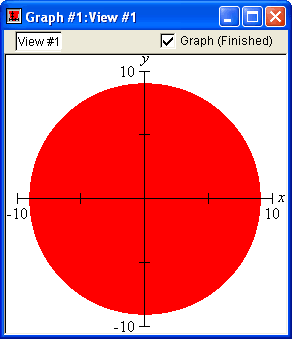
GrafEq allows users to choose patterns and colours for graphs. Users may blend the colours and patterns chosen, to highlight the regions common to the different relations. These features are particularly useful for displaying inequalities and for printing.
Colours
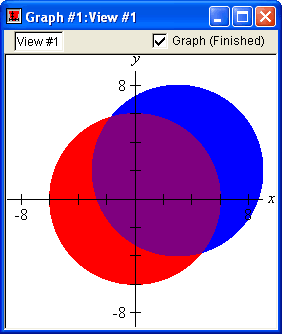
GrafEq allows users to choose patterns and colours for graphs. Users may blend the colours and patterns chosen, to highlight the regions common to the different relations. These features are particularly useful for displaying inequalities and for printing.
Robust Graphing
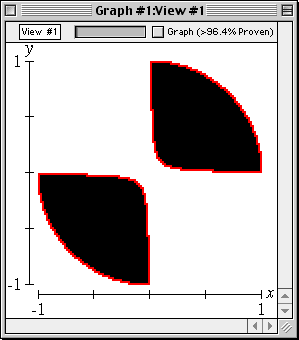
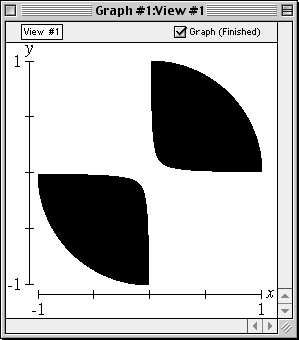
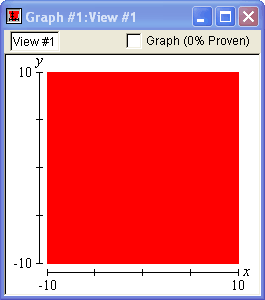
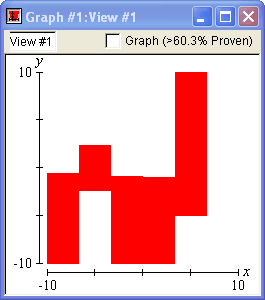
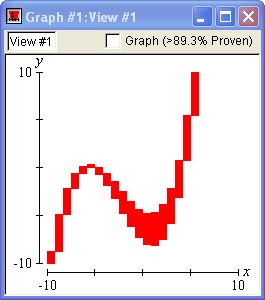
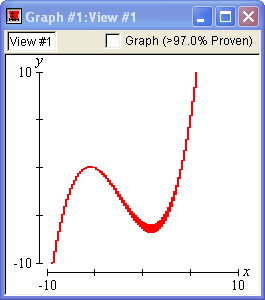
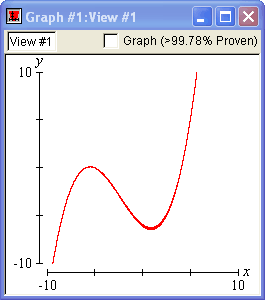
GrafEq can display detailed information about the knowledge it has of a graph by using three colours, rather than just the usual two. Normally, GrafEq displays a graph using two colours, with each colour signifying that either
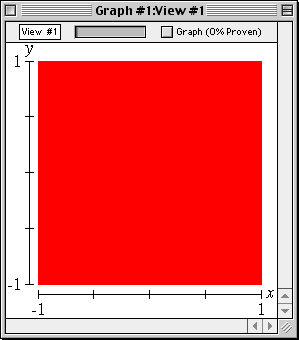
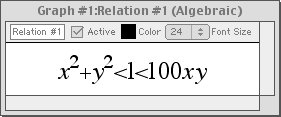
Almost immediately, black and white regions appear in the graph; both signify strong knowledge.
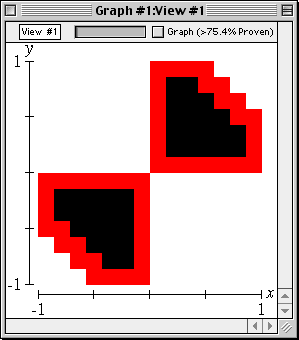
The red region dissolves over time, as GrafEq determines each pixel to be white or black.
In the end, there is no red left—every pixel has been decided.
Although no computer program can correctly graph every implicit equation, GrafEq is the most robust graphing program available. GrafEq appropriately handles floating-point round-off, as shown in our page on zooming. Our gallery and rogue’s gallery feature many examples of complicated graphs and equations which GrafEq correctly graphs.
Precise Graphing
GrafEq’s ability to precisely and robustly graph relations allow very satisfying graphs to be generated. A graphing program is:
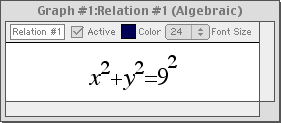
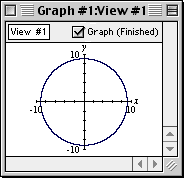
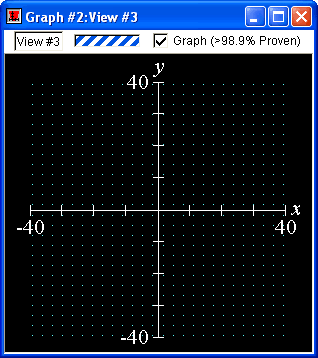
The following graph demonstrates the precision GrafEq is capable of:
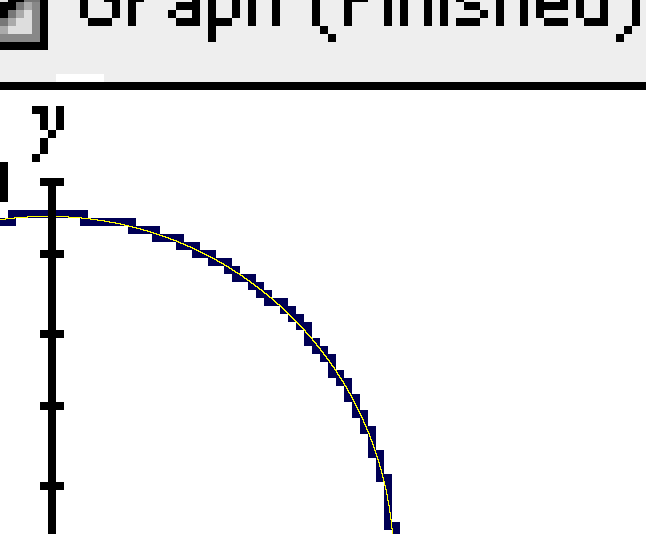
The following picture is a magnification of the upper right-hand portion of the preceding graph:
In the magnified display, the true graph has been overlaid in yellow; note that every pixel in the original graph is correct—a pixel is set (dark blue, in this case) if and only if the equation has a solution within the region the pixel represents. GrafEq is both accurate and precise in this graph.
Successive Refinement
Initially, GrafEq considers the entire view as containing possible solutions. As graphing proceeds, GrafEq deletes regions that do not contain any solutions. The remaining region continually shrinks, revealing the actual graph.
No computer program can correctly graph all equations. For some graphs, GrafEq may not be able to reveal the true graph: the precision provided by the host platform may be insufficient (usually after a succession of zooms), or the equation may simply be too complicated for GrafEq. GrafEq can graph a wide variety of equations; see either the gallery or the rogue’s gallery for some examples of complicated graphs which GrafEq correctly graphs.
File Formats
GrafEq can save and open files in four different formats:
Singularities
GrafEq plots graphs with singularities correctly, as it uses a successive refinement graphing method.
Transformations
GrafEq supports plotting of multiple graphs on the same viewport, so the effects of various transformations can be clearly displayed.
Simultaneous Systems
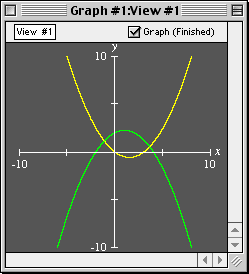
With GrafEq, you can overlay and / or blend multiple relations in one viewport. Points common to several relations can be discovered visually. These features are especially useful with inequalities.
Intercepts
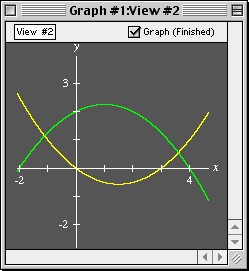
With GrafEq, relation-axis intercepts can be discovered visually. Precise coordinates can be found by zooming in.
Linear Functions
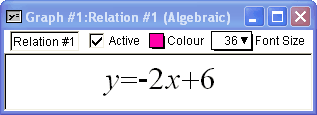
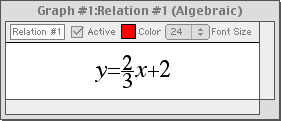
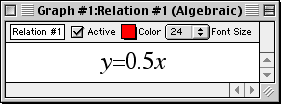
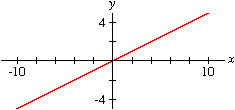
Many properties of linear graphs can be explored using various
GrafEq features.
|


![x=sint;y=cost;t in [pi/3,4pi/3]](spec/img/parametric1.gif)
![x-y graph of x=sint;y=cost;t in [pi/3,4pi/3]](spec/img/parametric2.gif)
