The Sine Function
In this lesson, we shall use GrafEq to
- graph the sine function y=Asin(Bx-C)+D and, through experiments,
- determine the graphical significance of the values of
A, B, C, and D in the equation.
The students should already be aware of the geometric
definitions of amplitude, period, and phase shift.
- Launch GrafEq
by double clicking its icon. Click on the title screen to remove it.
- Type in the equation y=Asin(Bx-C)+D.
- Press the Tab key, and assign a value to A by typing
“A=1”.
- Press the Tab key again, and assign a value to B by typing
“B=1”.
- Press the Tab key again, and assign a value to C by typing
“C=0”.
- Press the Tab key again, and assign a value to D by typing
“D=0”.
Your input window is now complete.

- Press the Return key to get the Create View window.
The default mode (Cartesian) is correct.
For the y-axis, the default bounds (-10 to 10) are fine.
For the x-axis,
- click on the upper bound box and change it from 10 to 5, then
- click on the lower bound box and change it from -10 to -5.
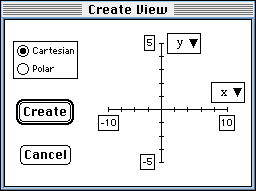
- Click on the Create button.
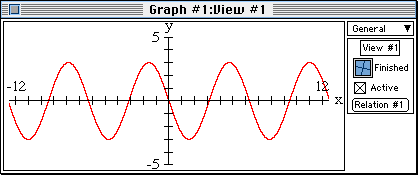
GrafEq will plot the graph of y=sinx.
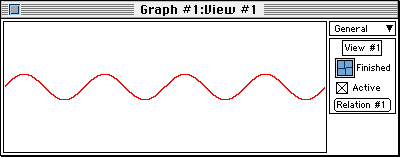
- The side-bar is currently showing general information.
To display ticked axes:
- click on the General button and drag the highlight bar to
Ticks;
- under the Simple submenu, click on the box which
has dense ticks on both axes;
- click the Active checkbox to display the ticked axes.
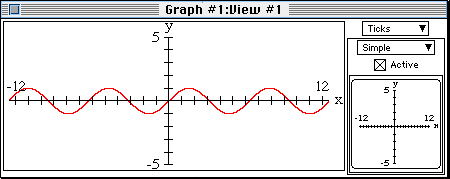
- Note that this graph
- has an amplitude of 1,
- has a period a bit greater than 6, and
- passes through the origin (0,0).
Now, we want to investigate the graphical significance of the value of A
in our sine function y=Asin(Bx-C)+D.
- For this section of the lesson, we will keep the values of B, C,
and D constant at 1, 0, and 0 respectively,
so our reference curve, with A at 1, is
y=sinx.
If you had started this lesson from the beginning,
these values are already set in the previous section.
- Change the value of A from 1 to 2:
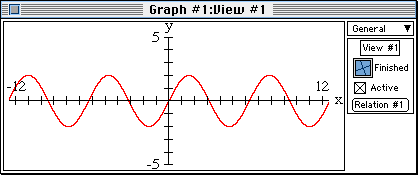
- click on the Ticks button and drag the highlight bar to
General;
- click on the Relation #1 button to display the relation input window;
- click on the “A=1” constraint, and change 1 to 2.
- Press the Return key to view the sine curve
y=2sinx.
Note that the period of the curve is unchanged and no shift occurs.
 Q: What is amplitude of this curve?
Enter this value on line 2 of the table.
Q: What is amplitude of this curve?
Enter this value on line 2 of the table.
- Repeat the necessary steps, as described above, to graph
y=-3sinx.
Note that the period of the curve remains unchanged,
while the graph is flipped horizontally.
 Q: What is amplitude of this curve?
Enter this value on line 3 of the table.
Q: What is amplitude of this curve?
Enter this value on line 3 of the table.
- Anticipate and enter on lines 4 and 5 of the table the effects of changing
the value of A to -4 and 5 respectively.
Confirm your answer with GrafEq
by graphing y=-4sinx
and y=5sinx
(by setting A=-4 and A=5 respectively).
- Q: What general conclusion can you draw about the graphical
significance of the value of A in our sine function
y=Asin(Bx-C)+D?
Put your answer on the conclusion line of the table.
Next, we want to investigate the graphical significance of the values of B
in our sine function y=Asin(Bx-C)+D.
- For this section of the lesson, set the value of A to 3, and
keep the value of D and C at 0, so our reference sine
curve, with B at 1, is
y=3sinx.
- To clearly show the graphical significance of the values of
B and C in our sine function, we want to introduce
an extra set of custom ticks on our graph. To do this,
- choose New Custom Ticks from the Graph menu,
- enter “x=k(π/2)”,
- click on the Labels/Upper box, and choose
Labels/Alt#1,
- click on the lines/solid box, and choose
lines/dotted,
- click on the Tick Font/Moderate box, and choose
Tick Font/Smaller, and then
- click on the Active box.

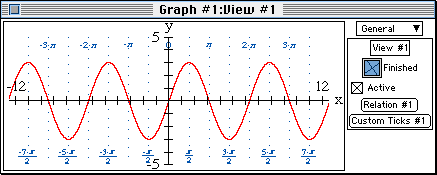
- Study the reference sine curve with its new custom ticks added. Note that
- the amplitude of the curve is 3,
- the curve passes through (0,0), and
- the period is 2π.
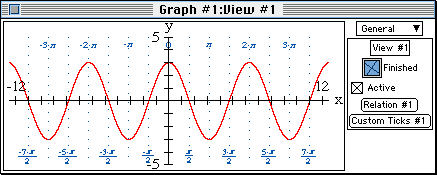
- Change the value of B from 1 to -2, to view the sine curve
y=3sin(-2x).
Note that the amplitude is unchanged, while the graph is flipped horizontally.
The period is reduced by 1/2, from 2π to π.
With these observations, complete line 7 of the table.
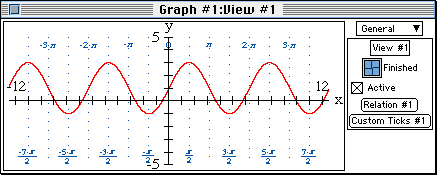
- Anticipate and enter on lines 8, 9, 10, and 11 of the table the effects
of changing the value of B to 2, 1/2, -1/2, and 4 respectively.
Confirm your answer with GrafEq.
- Q: What general conclusion can you draw about the graphical
significance of the value of B in our sine function
y=Asin(Bx-C)+D?
Put your answer on the conclusion line of the table.
Next, we want to investigate the graphical significance of the values of C
in our sine function y=Asin(Bx-C)+D.
- For this section of the lesson, reset the value of B to 1, and
keep the values of A and D at 3 and 0 respectively,
so our reference sine curve, with C at 0, is
y=3sinx.
The amplitude of the curve is 3, and the period is 2π.
The curve passes through the origin (0,0); its phase shift is 0.
- Change the value of C from 0 to (-π/2), to view the sine curve
y=3sin(x+π/2).
Note that the amplitude and the period of the curve are unchanged.
The curve is shifted by π/2 to the left, from the origin (0,0),.
Enter these observations on line 13 of the table.
- Change the value of C to π/2, to view the sine curve
y=3sin(x-π/2).
Complete line 14 of the table with your observation.
- Keeping the value of C at π/2, change the value of
B from 1 to 2, to view the sine curve
y=3sin(2x-π/2).
Note that the amplitude is unchanged while the period is reduced by 1/2,
from 2π to π.
The curve is shifted by π/4 to the right, from the origin (0,0).
Enter these observations on line 15 of the table.
- Anticipate and enter on lines 16, 17, and 18 of the table the effect of
changing the values of B and C as given on the table.
Confirm your answer with GrafEq.
- Q: What general conclusion can you draw about the graphical
significance of the value of C in our sine function
y=Asin(Bx-C)+D?
Put your answer on the conclusion line of the table.
Lastly, we want to investigate the graphical significance of the value of
D in our sine function y=Asinx+D.
- For this section of the lesson, set the value of A to 2,
B to 1, and C to 0, so our reference sine curve,
with D at 0, is
y=2sinx.
The amplitude of the curve is 2, and the period is 2π.
The curve passes through the origin (0,0); both its phase shift and
vertical shift are 0.
- Change the value of D from 0 to 1, to view the sine curve
y=2sinx+1.
Note that the amplitude, the phase, and the period of the curve
are all unchanged. The entire graph is shifted upwards by 1.
Complete line 20 of the table.
- Anticipate and enter on lines 21 and 22 of the table the effects of changing
the value of D to -2, and 3 respectiely.
Confirm your answer with GrafEq.
- Q: What general conclusion can you draw about the graphical
significance of the value of D in our sine function
y=Asin(Bx-C)+D?
Put your answer on the conclusion line of the table.
|
| line # |
A |
B |
C |
D |
Equation |
Amplitude |
Period |
Phase Shift |
Vertical Shift |
|
| 1 |
1 |
1 |
0 |
0 |
y=sinx |
1 |
— |
— |
— |
| 2 |
2 |
1 |
0 |
0 |
y=2sinx |
|
— |
— |
— |
| 3 |
-3 |
1 |
0 |
0 |
y=-3sinx |
|
— |
— |
— |
| 4 |
-4 |
1 |
0 |
0 |
y=-4sinx |
|
— |
— |
— |
| 5 |
5 |
1 |
0 |
0 |
y=5sinx |
|
— |
— |
— |
| 6 |
3 |
1 |
0 |
0 |
y=3sinx |
3 |
2π |
— |
— |
| 7 |
3 |
-2 |
0 |
0 |
y=3sin(-2x) |
|
|
— |
— |
| 8 |
3 |
2 |
0 |
0 |
y=3sin2x |
|
|
— |
— |
| 9 |
3 |
1/2 |
0 |
0 |
y=3sin(x/2) |
|
|
— |
— |
| 10 |
3 |
-1/2 |
0 |
0 |
y=3sin(-x/2) |
|
|
— |
— |
| 11 |
3 |
4 |
0 |
0 |
y=3sin4x |
|
|
— |
— |
| 12 |
3 |
1 |
0 |
0 |
y=3sinx |
3 |
2π |
0 |
— |
| 13 |
3 |
1 |
-π/2 |
0 |
y=3sin(x+π/2) |
|
|
|
— |
| 14 |
3 |
1 |
π/2 |
0 |
y=3sin(x-π/2) |
|
|
|
— |
| 15 |
3 |
2 |
π/2 |
0 |
y=3sin(2x-π/2) |
|
|
|
— |
| 16 |
3 |
2 |
1 |
0 |
y=3sin(2x-1) |
|
|
|
— |
| 17 |
3 |
2 |
-2 |
0 |
y=3sin(2x+2) |
|
|
|
— |
| 18 |
3 |
2 |
4 |
0 |
y=3sin(2x-4) |
|
|
|
— |
| 19 |
2 |
1 |
0 |
0 |
y=2sinx |
2 |
2π |
0 |
0 |
| 20 |
2 |
1 |
0 |
1 |
y=2sinx+1 |
|
|
|
|
| 21 |
2 |
1 |
0 |
-2 |
y=2sinx-2 |
|
|
|
|
| 22 |
2 |
1 |
0 |
3 |
y=2sinx+3 |
|
|
|
|
|
| Conclusion |
A |
B |
C |
D |
y=Asin(Bx-C)+D |
|
|
|
|
|
|