4 The Create View Window
The create view window is for specifying attributes for the new view window to be created.
Example attributes are graph type (cartesian or polar),
and view scope (variables and bounds).
The create view window can be brought up by selecting New View from
the Graph menu.
It also appears automatically if the current graph does not have any views open, and
a relation specification is completed by pressing the enter key.
The create view window comes in two modes;
a cartesian mode and a polar mode,
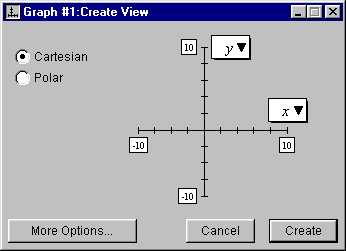
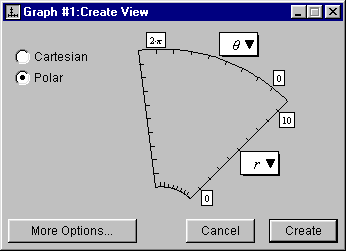
as shown in figure 4.1:

|

| |
Cartesian mode
|
Polar mode
|
Figure 4.1: Two create view windows
The create view window contains the following elements:
- two graph radio buttons,
- a domain and a range pop-up menu,
- four bound edit boxes,
- a Cancel button,
- a Create button, and
- a More Options... button.
The elements of the create view window are explained as follows:
- Cartesian and Polar radio buttons
- The Cartesian and Polar radio buttons are for changing the
coordinate system used for plotting. They are in the upper left area of the create view window.
GrafEq sets the mode to Polar only if r or θ are the variables
in the constraint specification; otherwise, GrafEq sets the mode to Cartesian.
The mode can be changed by clicking on the other radio button or on its name.
| Hint: | If x and/or y, as well as r and/or θ, is used in a relation specification,
GrafEq sets the mode to Cartesian. |
|
- Domain and range pop-up menus
- A variable pop-up menu is adjacent to each of the domain and range axes. They are for
specifying the variables used for each axis of the new view.
In the Cartesian mode, the variables default to x and y;
in the Polar mode, they default to r and θ.
For a graph specified in variables other than x and y, or r and θ,
the variables can be changed by
clicking on the respective pop-up menu to bring up the menu of available
variables, and then selecting a new variable from the menu.
- Bound edit boxes
- Two sets of upper and lower bound edit boxes are adjacent to each of the
domain and range variable axes.
They are for specifying the bounds of the graph.
In Cartesian mode, the default bounds are -10 to 10 for both x and y;
in Polar mode, the default bounds are 0 to 10 for r, and 0 to 6.28 for θ.
Any of the bounds can be changed by first clicking inside their
respective edit boxes, and then editing the bounds. Bounds can be simple numbers, or
numeric expressions.
| Hint: | When variable bounds are being edited, an easy button floating window
is available for help in expression entry. Easy buttons are especially useful
when entering symbols not readily available from the standard keys on a keyboard,
such as π, or any powers.
For details, refer to the The Easy Button Floating Window chapter. |
|
| Hint: | Instead of the mouse, the Tab key or the arrow keys can be used to move among the edit boxes. |
|
- Create button
- The Create button is in the center left area of
the create view window, and is for closing the create view window and opening
the specified new view window.
| Hint: | Plotting of all active relations of the current graph will commence in
the new view in the new window unless automatic graphing is turned off in
the option or preference settings. |
|
- Cancel button
- The Cancel button is for aborting the creation of a new graph view. It is
right below the Create button.
Clicking on it will simply close the create view window without creating a new view.

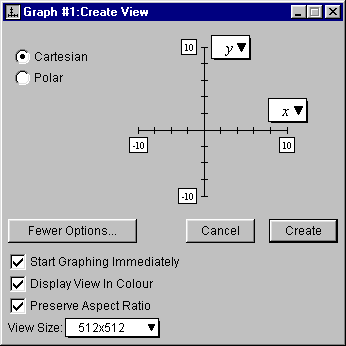
Figure 4.2: Two create view windows
- More Options... button
- The More Options... button is in the bottom center of the create view window.
Click it; the additional options will be displayed, and the
More Options... button will become a Fewer Options... button.
The additional view creation options are explained as follows:
- Start Graphing Immediately checkbox
- The Start Graphing Immediately checkbox is for controlling whether or not
GrafEq starts plotting immediately and automatically after the graph view is created.
If the option is unselected, GrafEq waits until the Graph checkbox
in the view window’s parameter bar is selected to start plotting, which might be
desired during explanation or presentations.
Clicking on the checkbox toggles between the selected and unselected states.
- Display View in Colour checkbox
- The Display View in Colour checkbox is for choosing between
a colour view or a black-and-white view.
The black and white option is useful for printing to a black-and-white printer.
Clicking on the checkbox toggles between the selected and unselected states.
| Hint: | The black and white option is also useful for exporting to another application,
such as a word processor, for further processing and subsequent black-and-white printing.
|
|
- Preserve Aspect Ratio checkbox
- The Preserve Aspect Ratio option is for setting the aspect ratio
fixed at one. If the option is deselected, aspect ratio depends on the variable bounds.
- View Size pop-up menu
- The View Size pop-up menu is for changing the
size of the graph view on the monitor. GrafEq determines the default view size according
to the size of the monitor used. The default size can be changed by
clicking on the View Size pop-up to bring up a menu of
available sizes, and then select a size from the menu.
| Hint: | View dimensions are measured in pixels.
For high resolution display or printouts, select large values from the
View Size pop-up menu to achieve best results. |
|
Conclusion
To conclude this chapter of the manual,
following is an additional hint about the create view window:
- If the create view window is brought up by pressing the enter key from an
algebraic relation window, the relation specification is completed:
the algebraic window collapses to display just the title bar, parameter bar and
constraint field(s) - prompts, the blinking cursor, the keystrokes field, and the easy
button floating window will all disappear.
|
|


