1 The Algebraic Relation Window
The algebraic relation window lets you enter a relation algebraically.
This window appears after the title screen disappears.
Additional algebraic windows can be brought up by selecting New Relation from the Graph menu. Figure 1.1, which follows, shows a blank algebraic relation window.
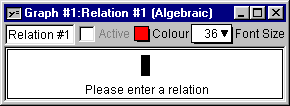
Figure 1.1: A blank algebraic relation window
The algebraic relation window consists of the following elements:
- a title bar,
- a parameter bar, and
- some constraint fields.
In addition, an easy button floating window
is available for help in relation entry. Easy buttons are especially useful when
entering symbols that are not readily available from the standard keys on a keyboard, such as
π, or exponents. For details, refer to the The Easy Button Floating Window chapter.
| Hint: | An algebraic window’s title bar, parameter bar, and relation constraints
are synchronized with, or equivalent to, their structural relation window counterparts.
Custom ticks windows have the same set-up for title and parameter bars. |
|
We will now discuss each of the elements of the algebraic relation window in turn.
- Title bar
- The title bar displays the graph title and the relation title followed by
the “(Algebraic)” label. The “(Algebraic)” suffix distinguishes it from the title bar of the
structural relation window. The relation’s title can be changed using the
parameter bar’s title edit box.

Figure 1.2: The title bar of an algebraic window
- Parameter bar
- The parameter bar is for customizing the relation title, starting and
stopping graphing, modifying the graph colour, and changing the font size
used to display constraints within the algebraic relation window.

Figure 1.3: The parameter bar of an algebraic window
The elements, from left to right, are as follows:
- Title edit box
- The title edit box lets you change a relation’s title.
Custom titles are useful in demonstrations and for print-outs.
The default title, “Relation #1”, is easily changed:
click on the title edit box to start editing.
The new title will replace the old one in all menus,
windows, and buttons that show the relation’s title.
- Active checkbox
- The Active checkbox is for starting and stopping relation plotting
in open graph view windows.
Clicking on the checkbox, or the checkbox name, toggles between the selected and
unselected states.
Deselecting the checkbox halts graph plotting and hides the relation from all graph views.
Selecting the checkbox resumes graph plotting from where it left off and shows the relation
in all graph views.
| Hint: | The Active checkbox is greyed out and unavailable if any constraint
of the relation is invalid. |
|
- Colour pop-up menu
- The Colour pop-up menu is for changing the colour used for the
relation in graph views.
This control is useful for optimizing the clarity of graph views.
The colour can be changed by clicking on the Colour
box to access the pop-up colour menu,
and then selecting the desired colour from the menu.
For black-and-white graphs, a Pattern pop-up menu replaces the
Colour pop-up menu.
Colour computers can display black-and-white graphs. For more information,
refer to the colour buddy section of the
The View Buddy Floating Windows chapter.
- Font Size pop-up menu
- The Font Size pop-up menu is for changing the font size used to display
relation constraints in the relation window.
This control is useful for presentations via an overhead liquid
crystal display (LCD) or a large screen television. The font size can be changed by
clicking on the Font Size pop-up menu to bring up a
menu of available font sizes, and then selecting the desired size from the menu.
All constraints of the current algebraic relation window will be displayed in the
selected font size.
| Hint: | Some options in the algebraic relation window’s parameter bar do not change
the behaviour or the appearance within the algebraic window itself.
- The Active checkbox affects the behaviour (graphing) of
graph view windows.
- The Colour pop-up menu affects the appearance (graph colour)
of graph view windows.
|
|
- Constraint fields
- Constraint fields are for entering relation constraints.
The constraints entered are displayed in standard mathematics format, which is
desirable when including relations in handouts or documents (by copying formulas
from GrafEq and pasting them into a word processor).
The formatted presentation also gives some visual feedback that the constraints are
interpreted as intended.
Figure 1.4 shows a sample relation with two constraints (in two constraint fields):
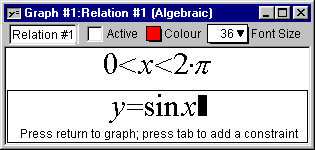
Figure 1.4: An algebraic window with two constraint fields
While a constraint is being entered or edited,
- prompts can appear at the bottom of the constraint field;
- the easy button floating window, if enabled, comes up to offer support for
the specification process;
- a cursor blinks at the current edit position if no formula, or portion thereof, is selected;
- the Active checkbox of the algebraic window is unselected and
greyed out, unless all constraints of the relation are valid.
Pressing the Tab key will move the cursor to the next constraint. If there is no next constraint,
a new one is added. Pressing the Shift key-the Tab key will move the cursor to the previous constraint.
If there is no previous constraint, a new one is added.
When a multi-letter function, such as “sin”, is entered, the characters
are unformatted and presented in red until GrafEq recognizes them as a function name.
Red signifies unrecognized entries. GrafEq interprets
“sin” as the sine function instead of the product “s×i×n”
only after an argument, such as x, is entered. A good example is the square root function,
when entered as “sqrt”: GrafEq will replace the letters with a graphical
radical symbol after you begin entering its argument.
| Hint: | If the cursor is positioned away from the end of the relation string
during editing, all characters to the right side of the cursor become unformatted.
With the default preference settings, unformatted characters are
shown in solid red on colour displays, while they are outlined in black
(not filled in) on black-and-white displays.
|
|
| Tip: | The “Symbol” and “Times” TrueType fonts must be installed
in order to produce attractive screen output, unless the font settings have been
changed in the preferences. |
|
| Tip: | More information on the format and structure of constraints and
the parser is available in the How GrafEq Works chapter. |
|
Conclusion
Here are some additional hints and tips about the algebraic relation window:
- Each algebraic relation window describes one relation. The relation can
be defined using a single constraint or multiple constraints. Additional
constraint fields can be
brought up by pressing the Tab key from within the algebraic relation window.
- Each graph can have one or more relations. Each relation is described in one
algebraic window, and is normally assigned a colour different from that of the other
relations. Additional algebraic windows can be opened
by selecting New Relation from the Graph menu.
Relations from the same graph are plotted on the same views using the same coordinate system.
- New graphs can be opened by selecting New Graph from the File menu.
When a new graph is opened, a new algebraic relation window appears automatically.
The default graph title is “Graph #k”, where k is
a new sequence number. Different graphs are unrelated. To view multiple relations
in the same window, multiple relations are created within one graph.
- Besides the algebraic window, each formula may be presented as a tree
in a structural relation window. Corresponding algebraic and structural windows are
synchronized, so common attributes can be changed in either window and are reflected in both.
Common attributes include the relation title, graphing activity, and relation colour.
The tree structure representation in the structural relation window is
a new feature introduced in GrafEq 2.04. For details, see the
The Structural Relation Window chapter.
- The keystrokes field is a strip beneath the current constraint field. It shows the
keystrokes used to produce the formatted relation shown in the
constraint field. Keystroke information is especially useful when the intuitive mathematics
symbols and notation have no obvious correspondence with the keys on a keyboard.
Figure 1.5, which follows, shows a sample keystrokes field with its corresponding constraint field.
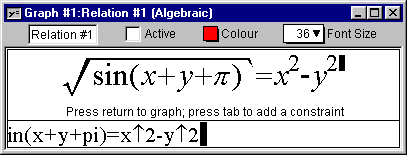
Figure 1.5: An algebraic window with its keystroke field
Prior to version 2.04, GrafEq always provided this information via the keystroke field.
But as of GrafEq 2.04, keystroke information can be revealed within
the constraint entry fields by positioning the cursor to the left of the entries.
The keystroke field is hidden using the default preferences, although
it is still available and remains useful for printing purposes.
To hide or show the keystrokes field, use the preferences window.
- A relation entry can be completed by selecting the
Active box of its algebraic window or by pressing the enter key.
When formula entry is complete
the algebraic window will collapse to display just the title bar, parameter bar, and
constraint fields—prompts, the blinking cursor, the keystroke field, and
the easy button floating window
will all disappear. While the Active checkbox will initially be selected, it can be
toggled freely without editing any constraints.
- Clicking within any constraint field of a completed algebraic window
will return you to the edit mode and remove the relation
from any opened graph views.
|
|